
Take a quick look at MPG using box plot, t-test and build a regression model
This project assumes that you work for Motor Trend, a magazine about the automobile industry. Looking at a data set (mtcars from datasets library) of a collection of cars, they are interested in exploring the relationship between a set of variables and miles per gallon (MPG) (outcome). They are particularly interested in the following two questions:
- “Is an automatic or manual transmission better for MPG”
- “Quantify the MPG difference between automatic and manual transmissions”
The purpose of this project report is to address above two questions use the knowledge from course 7 regression models.
Can you draw any conclusion from following plot for the first question?
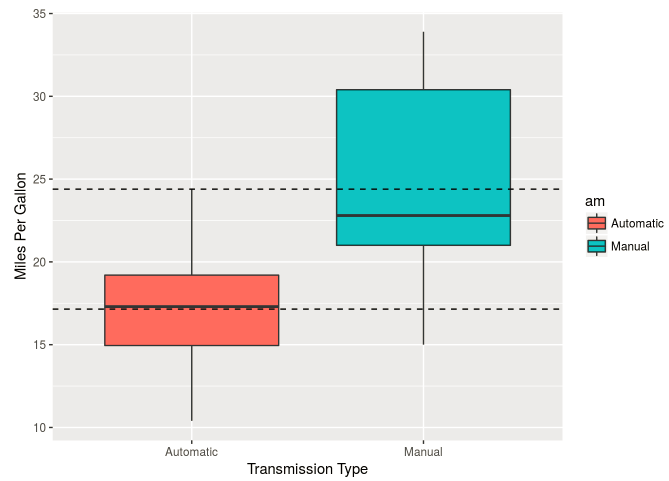
Statistical analysis (t-test) for the second question and more can be found on RPubs
Written on December 31, 2017