
Central Limit Theorem(CLT) test with R
In this simple note, I will investigate the exponential distribution in R and compare it with the Central Limit Theorem(CLT). CLT tells us that sample mean distribution is a normal distribution when sample size is large enough (for example >30). Expected value of sample mean distribution is used to estimate population mean. Sample mean variance is population variance divided by sample size.
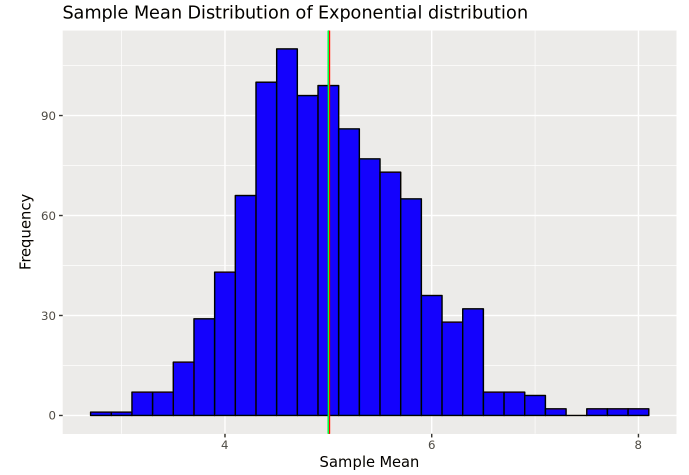
In following plot, red line stands for sample mean and green line stands for theoretical mean.
This simple note is from Data Science course by JHU in Coursera. For details check on RPubs
Written on December 31, 2017